Churn Reduction Roadmap Guided by VoC Analysis
We needed data to inform which churn issues to prioritize, fast. Customers were already telling Support and their account managers what was wrong, so we decided to lean on this data to get results by the following week, when they were needed. Based on the product areas we were told to focus on, we delivered an interactive artifact that broke down key issues, so PMs could shortlist issues into a potential roadmap plan for their area.
At a glance
Problem. Customers were leaving, and product teams were given churn focus areas without knowing the specific issues causing churn within each area.
What I did. Designed a repeatable theming method, built it as a Claude skill, and ran it across four areas of support data.
Outcome. Gave PMs insight into specific, actionable issues for their product areas. It will be used to decide roadmap priorities and to raise awareness of system issues that engineering teams can tackle.
Research question
What specific issues are customers raising about reporting, scheduling, and workflow and AI automation?
Approach
Each area was exported from Salesforce and analyzed separately with the same four-step process. I built the process as a reusable Claude skill, so it runs the same way every time and can be rerun on a new export.
- Remove any duplicates.
- Trim the communication data to only relevant information. Some data came from calls where several topics were discussed.
- This sets up later steps so agents read less data, which lowers the risk of AI misclassifying records or wasting tokens re-reading long text full of unneeded detail.
- Suggest categories or themes based on a sample of the data.
- I review them by hand to make sure the groupings make sense, and that no areas are missing or need to be broken down further.
- Count mentions, to understand how often a theme or subtheme came up.
- Count unique accounts per theme or subtheme, to understand how much of our customer base is affected, and to make sure the same customers aren't inflating the numbers.
Decisions that shaped the study
Rank by accounts, not mentions
One frustrated customer can file a dozen tickets about the same bug. Counting unique accounts keeps theme sizes from being inflated by a few loud customers, and accounts are the unit that churns.
A human approves the themes first
The model proposed themes, but tagging only started once I had reviewed and approved the set. That kept the categories meaningful to product teams.
No tag without a quote
Every tag links to the customer's own words. Any PM can check why a record was counted, which makes the numbers easier to trust and to challenge.
Design for the decision
I shipped a working tool PMs could use to prioritize without research in the room, not a readout deck. I rolled it out to product leads first, then to PMs.
The shortlist tool
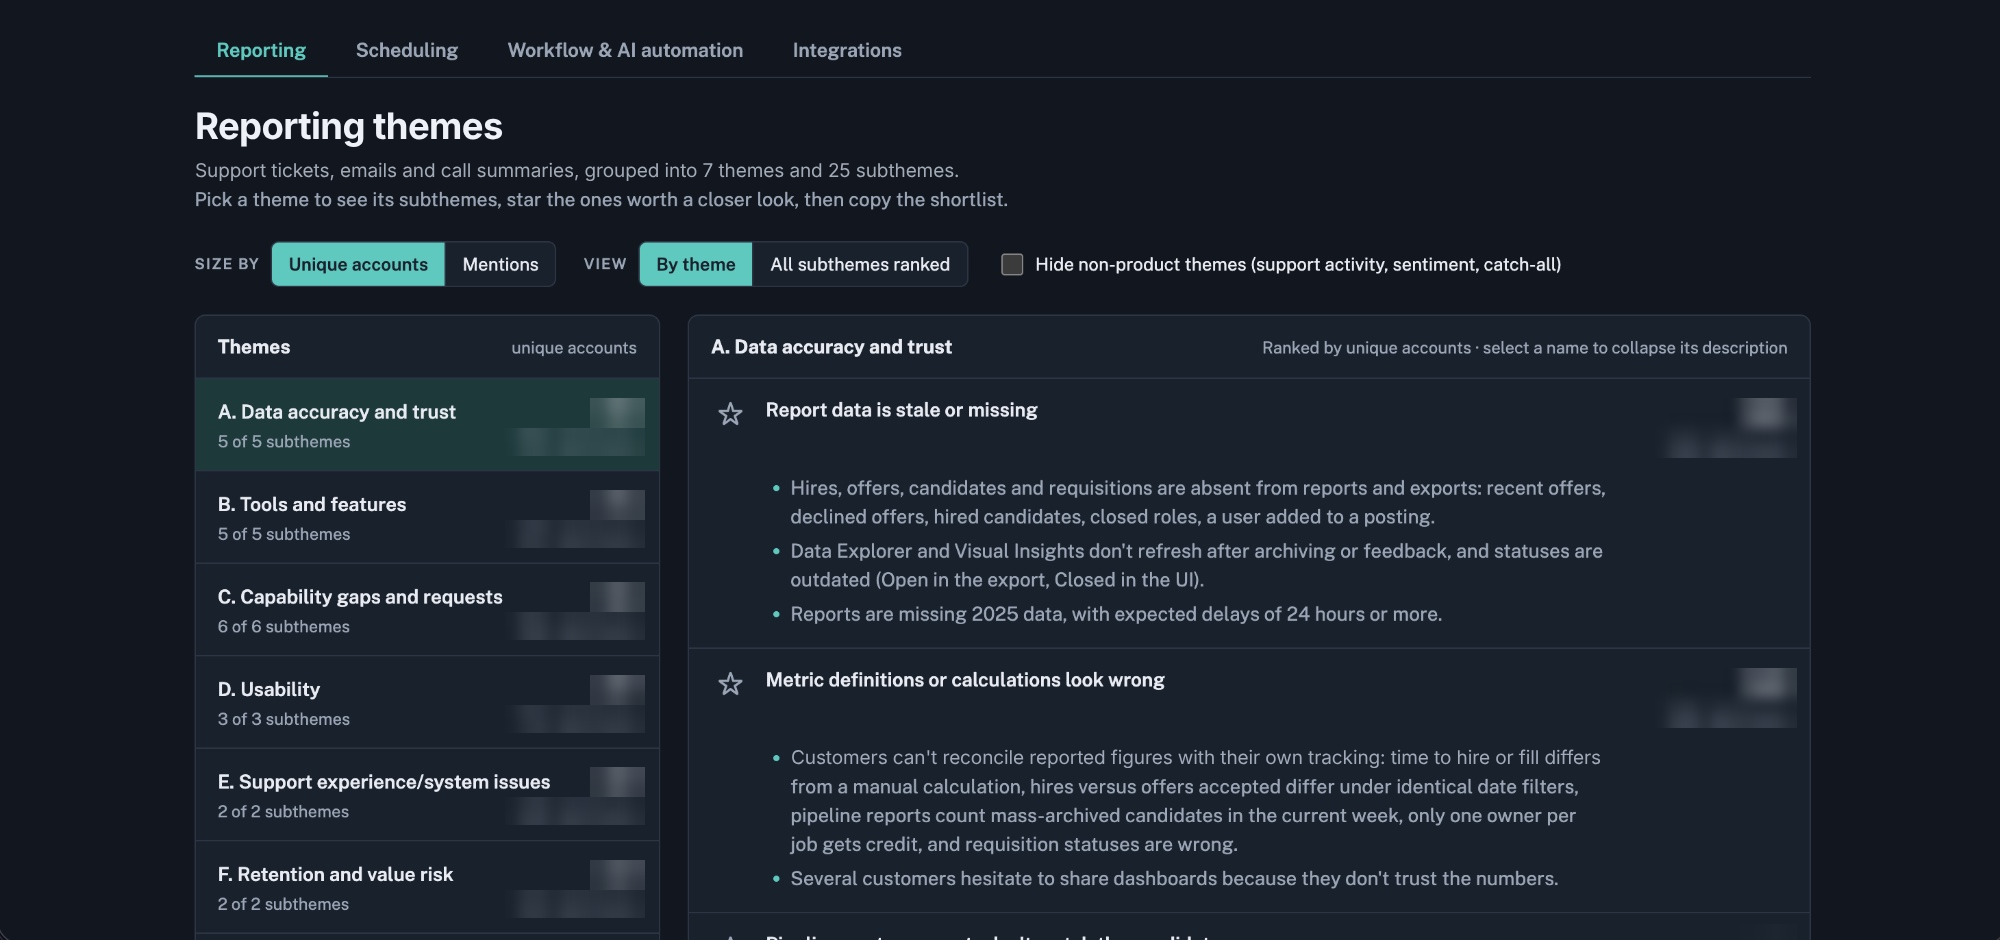
PMs get one tab per product area. They can rank subthemes by mentions or by unique accounts, hide non-product themes, star the subthemes they want to pursue, and copy their shortlist into a roadmap planning doc.
Conclusion
The findings of this analysis lined up with research I had done before. The year prior, I ran a survey built on an importance-satisfaction matrix to find churn areas, and it highlighted similar issues. Reporting, for example, was a high-priority area that was painful to use in our product.
This new analysis showed which issues may be less common now because of feature releases over the year, and which ones have yet to be addressed.
How confident to be
- Tagging was model-assisted.
- Tags came from a model working against an approved theme set with quotes as evidence, not from manual coding. Counts are a strong guide, not exact figures. Borderline calls sit mostly in the vaguer subthemes.
- The sample is people who contacted Support.
- It over-represents breakages and under-represents problems customers have stopped reporting. It shows what customers report, not how often a problem happens.
- Areas aren't comparable to each other.
- Each export was filtered for its own topic, so record counts can't be compared across tabs.
What I'd do next
- Trace the impact. Track which starred subthemes become engineering tickets or roadmap items.
- Check the scale with usage data. For the top reliability themes, such as calendar sync and stale report data, confirm with incident or usage data how often the problem actually happens.
- Rerun it. Because the method is a skill, the same analysis can run on a future export to track change over time, or on our company's other two products.